Inline charts and tables
Inline charts and tables
Ask for the commercial decision in your own words. You do not need to name a
chart. twelfth chooses the form that makes the answer easiest to read and keeps
the exact rows behind every visual.
How twelfth chooses
| Your goal | Answer form | Example |
|---|---|---|
| One fact or a short explanation | Prose | “What was sales last week?” |
| Exact products, suppliers or transactions | Table | “Which 20 products have the most stock at cost?” |
| Rank or compare a few things on one measure | Bar chart | “Which categories have the most stock value tied up?” |
| Follow change over time | Line or area chart | “How have weekly units moved against last year?” |
| Compare two measures and find outliers | Scatter chart | “Which products have high margin but low velocity?” |
| Decide what to invest in, protect, fix or prune | Matrix | “Where is the money across my categories?” |
The measures in one stacked chart must use the same unit. If they do not,
twelfth uses separate series or an exact table rather than drawing a false
comparison.
Example: a category ranking
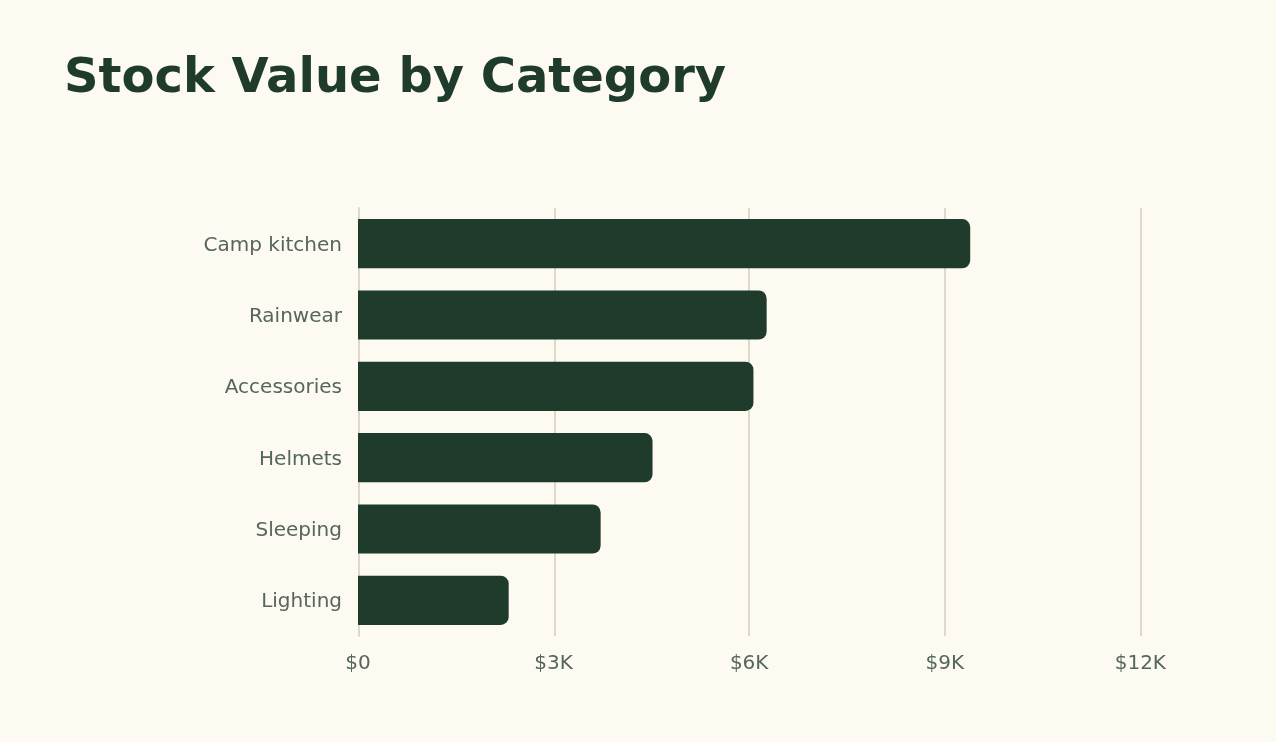
Illustrative example data.
The answer states the leading category in prose and keeps the complete category
rows behind the chart. A partial population is labelled as partial rather than
presented as the whole range.
Read the exact rows
Open the three-dot menu in the chart’s top-right corner and choose View as
table. The chart stays tied to the same evidence. Switching views does not
run the question again or produce a second set of figures.
| Category | Stock value at cost |
|---|---|
| Camp kitchen | $9,390.33 |
| Rainwear | $6,267.99 |
| Accessories | $6,065.39 |
| Helmets | $4,517.85 |
| Sleeping | $3,721.73 |
| Lighting | $2,311.24 |
Chart actions
The same menu provides:
- Download PNG: a 2× image with a solid light or dark background and the
chart’s full labels and values. - Copy link to chart: a link to the conversation, message and chart. Opening
it scrolls to that chart and highlights it. - Share with a person: available to the chat’s creator when the workspace
sharing policy allows it.
Sharing a chart grants read-only access to the whole live conversation, not an
isolated copy of the chart. A copied link never grants access by itself. See
sharing a standalone chat.
The same answer elsewhere
The presentation travels with its governed rows. Saved reports keep the chart
and exact table. twelfth for Excel places supported charts into the workbook as
native Excel charts. Supported AI apps can render the same presentation, while
other hosts still receive useful text and structured data.